
In fish farming, feed accounts for a significant proportion of production costs. Whether you operate a pond, above-ground tanks or floating cages, knowing how much feed is required to produce fish is essential for effectively managing your farm.
This is precisely what the Feed Conversion Ratio (FCR), also known as the feed conversion index (FCI), is used to measure.
What is the Feed Conversion Ratio?
Feed Conversion Ratio (FCR) is a commonly used indicator across all types of livestock and aquaculture farming. It provides an indication of the feed efficiency of a feed or feeding strategy. FCR measures the amount of feed used to produce one kilogram of biomass gain.
The formula is simple:
FCR = Amount of feed used ÷ Biomass gain
For example, if you provide 150 kg of feed and achieve a 100 kg increase in biomass:
FCR = 150 ÷ 100 = 1.5
This means that 1.5 kg of feed was required to produce 1 kg of biomass gain.
Under comparable conditions, a lower FCR therefore indicates better feed conversion efficiency.
How to Calculate Your FCR
To get a useful result, you need to keep track of three main figures:
the initial biomass;
the final biomass;
the total amount of feed used.
Example
A fish batch starts with a biomass of 100 kg.
At the end of the period, the estimated biomass is 500 kg.
The biomass gain is therefore:
500 − 100 = 400 kg
If the farmer used 600 kg of feed during the period:
FCR = 600 ÷ 400 = 1.5
The batch therefore has an FCR of 1.5.
Keep in mind that fish mortality must also be monitored, as it affects the biomass balance. For a meaningful assessment of feeding performance, FCR should be considered alongside the survival rate and growth performance of the fish.
What Is a Good FCR for African Catfish?
There is no universal value that can be considered a “good FCR” for all Clarias gariepinus farming operations.
FCR can vary depending on factors such as:
the size and age of the fish;
the quality and composition of the feed;
water temperature;
water quality;
stocking density;
feeding frequency and method;
fish health;
mortality;
overall farming conditions.
Scientific trials on African catfish also show different FCRs depending on the diet and experimental conditions. In one study involving juveniles, FCRs were around 1.9–2.0, depending on the feeds tested, while other studies have reported different values depending on the growth stage and feeding regime.
It is therefore more useful to compare your own production cycles and track how your FCR changes over time than to aim for a single “magic” number.
Why Is Feeding So Important?
A quality feed is not defined solely by its price or protein content.
Its composition, digestibility and suitability for the fish’s nutritional requirements can all affect growth and nutrient utilisation. Research on C. gariepinus has shown that feed formulation can have a significant impact on growth and feed conversion. However, even with a good-quality feed, poor feeding management can increase losses. Overfeeding, in particular, can lead to waste and increase the organic load in the pond or tank.
To improve your feeding management, you can also read our article:
Boost Your Fish Farm Operations: Tips to Maximise Your Profits
Water Quality Also Affects Performance
Feed is only one part of the equation. Poor water quality can affect feeding behaviour, growth and fish health. Monitoring parameters such as temperature, dissolved oxygen, pH, ammonia and nitrite is therefore an important part of managing a fish farm.
Water management, feeding and stocking density should not be considered separately. They are closely connected and should be managed as part of the same production system.
To learn more about catfish health:
How to Prevent and Treat Catfish Diseases
Average Weight: Essential for Proper Feed Management
To adjust feeding accurately, you need to regularly estimate the average weight of your fish. A simple way to do this is to weigh a sample of fish.
For example:
420 g for 14 fish
gives:
420 ÷ 14 = 30 g per fish
This estimate can then be used to calculate the batch’s biomass and adjust the daily feed ration accordingly.
The more regularly your data is updated, the more precise your feeding management becomes.
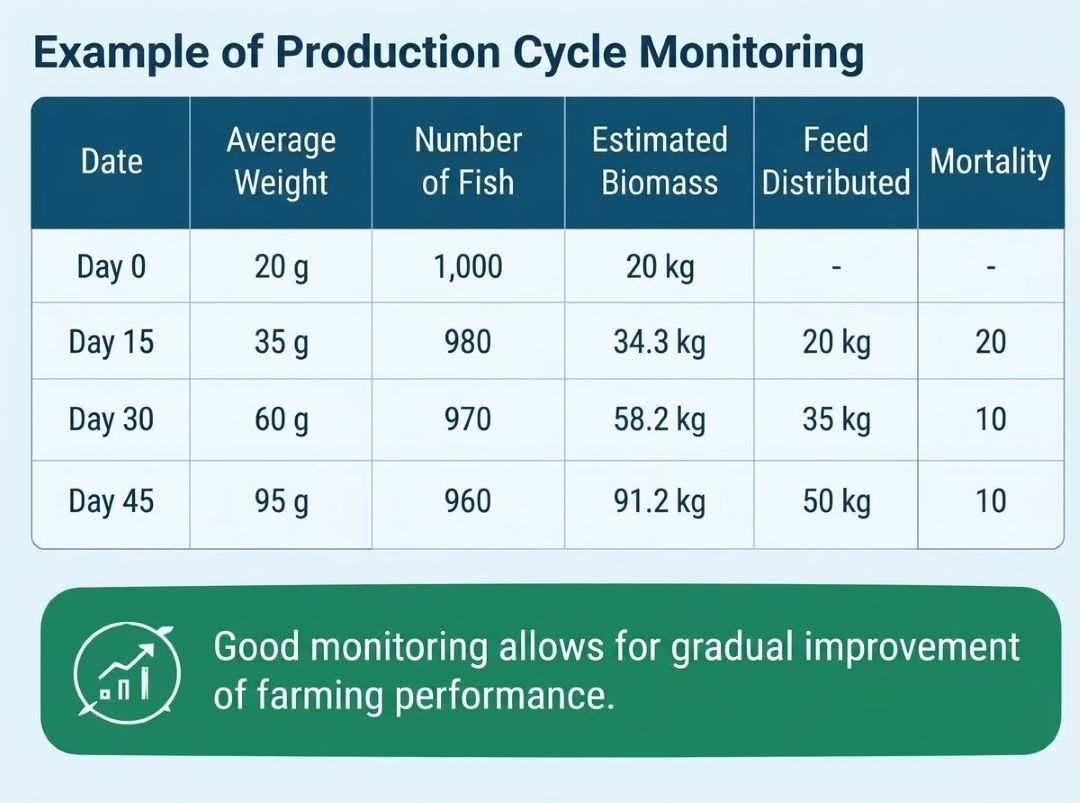
At the end of the production cycle, the accumulated data can be used to analyse the farm’s performance and calculate key indicators such as FCR.
The main benefit is being able to compare different production cycles. If your FCR improves from one cycle to the next, you can investigate what may have changed: feed quality, ration management, stocking density, water quality, feeding frequency or even how regularly fish weight was monitored.
We’ve prepared a production tracking Excel spreadsheet to help you record and monitor the key data from your fish farm.
👉 Simply comment “tracking file”, and we’ll send it to you.
FCR and Profitability: What Is the Connection?
FCR becomes particularly useful when you translate it into cost.
Suppose:
Feed: 600 FCFA/kg;
FCR: 1.5.
The feed cost required to produce 1 kg of biomass gain is therefore:
1.5 × 600 = 900 FCFA
If you manage to improve your FCR while maintaining good growth and survival rates, the feed cost per kilogram of fish produced can decrease.
This is why FCR should be viewed as both an economic and a production performance indicator.
To learn more about the financial management of a fish farm, visit our aquaculture blog: See all Gammer Studio articles.
How Can You Improve Your FCR?
Simply feeding less does not necessarily result in a better FCR. The goal is to use feed efficiently without compromising fish growth.
Here are some practical tips:
1. Weigh your fish regularly.
Keeping your average fish weight up to date helps you estimate the total biomass more accurately.
2. Adjust the feed ration.
The amount of feed provided should be adjusted as the fish grow and according to farming conditions. Download our app to help you calculate the daily feed ration: Odyssey Pisciculture.
3. Minimise feed waste.
Monitor feeding behaviour closely and avoid excessive feeding.
4. Use an appropriate feed.
Pellet size and feed composition should be suitable for the fish’s growth stage.
5. Monitor water quality.
Good environmental management helps maintain conditions that support healthy fish growth.
6. Record all your data.
Feed provided, average fish weight, biomass, mortality and harvest figures should all be recorded and monitored.
Use Your Data to Improve Future Production Cycles
The real value of FCR becomes clear when you compare several production cycles.
| Cycle | Feed used | Biomass gain | FCR |
|---|---|---|---|
| 1 | 500 kg | 300 kg | 1.67 |
| 2 | 520 kg | 350 kg | 1.49 |
| 3 | 510 kg | 380 kg | 1.34 |
This progression can help you identify which changes may have improved the performance of your fish farm.
The goal is therefore not simply to know your FCR at harvest, but to gradually build a performance history for your farm.
What If You Could Anticipate Your Costs Before Starting a Production Cycle?
That is precisely one of the goals of Odyssey.
The app provides production planning and financial forecasting tools that can help you estimate feed costs, production expenses, expected revenue and the potential profitability of a production cycle. It also offers aquaculture learning resources.
Discover Odyssey Pisciculture on Google Play
Plan your cycle, understand your figures and make better-informed decisions based on your data.
Key Takeaways
Feed Conversion Ratio (FCR) = feed used ÷ biomass gain.
An FCR of 1.5 means that 1.5 kg of feed is associated with 1 kg of biomass gain.
However, do not focus solely on achieving the lowest possible FCR. A well-managed fish farm should also maintain good growth, good survival rates and controlled production costs.
In aquaculture, every kilogram of feed counts.
Measure your performance. Compare your production cycles. Adjust your practices. And use your data to farm more intelligently.
Réagissez ici